Latitude vs. X
In this project, I created a Python script to visualize the weather of 500 randomly sampled cities from across the world of varying distance from the equator.
To accomplish this, I utilized the OpenWeatherMap API, Pandas, and Matplotlib to create and visualize a representative dataset of weather across world cities.
The objective was to build a series of scatter plots to showcase the following relationships:
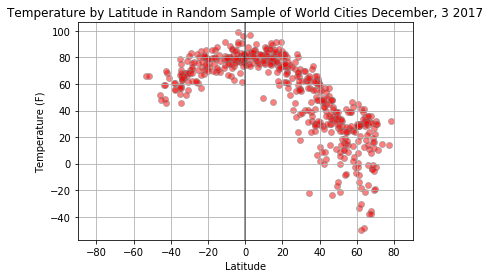
- Temperature (F) vs. Latitude
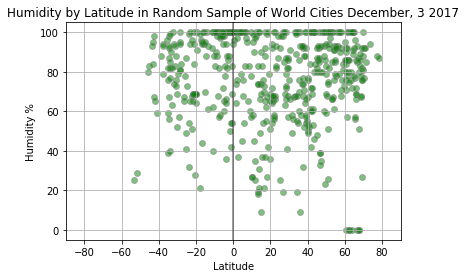
- Humidity (%) vs. Latitude
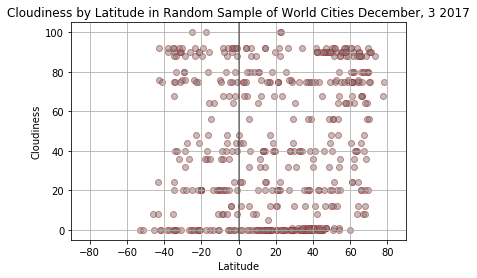
- Cloudiness (%) vs. Latitude
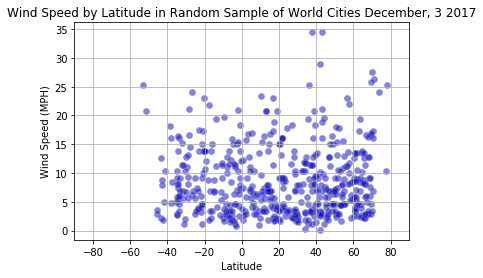
- Wind Speed (mph) vs. Latitude
Visualizations
Click on any thumbnail to view larger plot.
Lat vs. Temp
Lat vs. Windspeed
Lat vs. Humidity
Lat vs. Cloudiness